
Forecasts in this review
Measurement starts at publication and ends at the market price one day later (Friday forecasts are checked on Monday when markets reopen), with no revisions. Results are measured in points from the forecast price, positive when the market follows the predicted direction. A range-bound forecast is correct when the move stays within the noise threshold.
| Instrument | Forecast | Measurement, Moscow time | Price | Result | Outcome |
|---|---|---|---|---|---|
| EURUSD | range-bound | 10 Nov, 12:02 → 11 Nov, 12:02 | 1.1254 | — | pending |
| GBPUSD | range-bound | 10 Nov, 12:02 → 11 Nov, 12:02 | 1.3455 | — | pending |
| USDJPY | range-bound | 10 Nov, 12:02 → 11 Nov, 12:02 | 157.95 | — | pending |
| AUDUSD | range-bound | 10 Nov, 12:02 → 11 Nov, 12:02 | 0.6931 | — | pending |
| XAUUSD | range-bound | 10 Nov, 12:02 → 11 Nov, 12:02 | 4115.30 | — | pending |
| BTCUSD | range-bound | 10 Nov, 12:02 → 11 Nov, 12:02 | 74634 | — | pending |
EAs trading these instruments
Running on demo accounts with continuously updated statistics. Each EA listing includes its return chart.
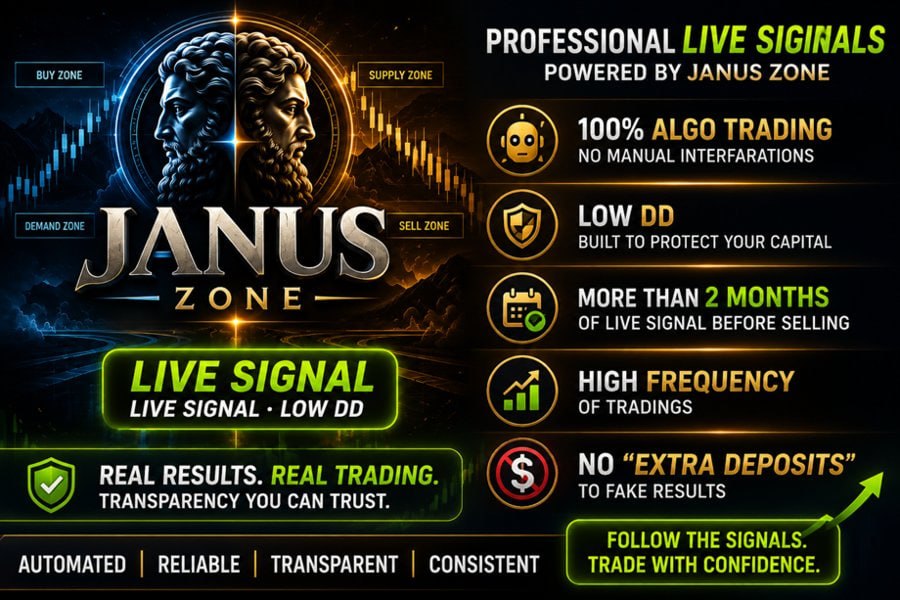 Janus_Zone_FixXAUUSD · live monitoring on the EA page →
 AiX_Gold_MT5_fixXAUUSD · live monitoring on the EA page →
 Quantum_iGold_MT5_4.1XAUUSD · live monitoring on the EA page →
 Portfolio Pulse FX — Three-Basket Forex DemoEURUSD · live monitoring on the EA page →
 Sprint FX Demo — Experimental MT5 Forex EAEURUSD · live monitoring on the EA page →
 Gold_Beaver_v5.57_FixXAUUSD · live monitoring on the EA page →
 Institutional_SMC_Robot_v1.70XAUUSD · live monitoring on the EA page →
 Gold_AQF_MT5XAUUSD · live monitoring on the EA page →
 QuantumTitan_MT5_v3.3XAUUSD · live monitoring on the EA page →
 Ghost_Scalper_v2.9XAUUSD · live monitoring on the EA page →XAU Breakout DemoXAUUSD · live monitoring on the EA page →
 Cosmos_Orion_2.1_fixXAUUSD · live monitoring on the EA page →
 Aura_Gold_Pro_Edition_fixXAUUSD · live monitoring on the EA page →
 GoldenShot_EAXAUUSD · live monitoring on the EA page →
 MartinGale_Gold_TPXAUUSD · live monitoring on the EA page →
 Luna_AI_Pro_MT5_v1.50EURUSD · live monitoring on the EA page →
 TradEApro Gold Breakout MT5 (our EA with source code)XAUUSD · live monitoring on the EA page →
 NeonGamer_EA_v1.4XAUUSD · live monitoring on the EA page →
 Gold_Liquidity_EA_V5.3_MT5XAUUSD · live monitoring on the EA page →
 EA_Gold_Stuff_MT5_V11XAUUSD · live monitoring on the EA page →
 Mavrik_Scalper_MT5_v18.306XAUUSD · live monitoring on the EA page →
 Quantum_Queen_MT5_V4.1XAUUSD · live monitoring on the EA page →
 Lizard_MT5_v1.72XAUUSD · live monitoring on the EA page →
 Gold_Snap_MT5_v2.0XAUUSD · live monitoring on the EA page →
 Gold_Trend_X_MT5_V2.695XAUUSD · live monitoring on the EA page →
Forex Market Analysis for 10 November 2026
Market Overview
The baseline outlook for the dollar is sideways trading until the release of US inflation data; the direction after the release remains uncertain. The outlook for the next 24 hours remains neutral, but with a substantial risk of breakouts after 13:30 UTC. The supplied data does not provide enough grounds to favor either dollar strength or weakness in advance.
This review uses quotes from approximately 09:00 UTC. EUR/USD is trading at 1.12540, GBP/USD at 1.34550, USD/JPY at 157.951, and AUD/USD at 0.69310. The euro and Australian dollar are near the upper boundaries of their daily ranges. However, the small rise in USD/JPY shows that the move cannot yet be described as a synchronized sell-off in the US dollar.
The medium-term picture is also mixed. The pound has gained 1.37% over 20 days, while the Australian dollar has lost 1.15%. The euro has risen just 0.11% over the same period. This means the relative strength of individual currencies is having a significant effect alongside the broader dollar factor.
Today's main events:
- 09:00 UTC — speech by FOMC member Christopher Waller. His assessment of inflation and the conditions for further rate changes will matter. The source data does not include the content of the speech, so it is premature to attribute a directional impact to it.
- 13:30 UTC — US monthly core CPI: forecast 0.2%, previous 0.3%.
- 13:30 UTC — US monthly headline CPI: forecast 0.3%, previous 0.6%.
The forecasts point to slower monthly price growth. However, the market reaction will depend primarily on how the actual figures compare with consensus. A decline from the previous month does not, by itself, constitute a negative surprise for the dollar.
Inflation above expectations could support the dollar by shifting interest rate expectations; readings below forecast could trigger the opposite response. If headline and core inflation send conflicting signals, an initial move followed by a reversal is likely.
The calculations below use current quotes. Changes in the latest snapshot and daily closing-price statistics are treated separately because they use different reference points. Some of the positions within the monthly ranges stated in the historical source data do not match current prices, so these have been recalculated as “current price minus the low, divided by the range width.” Calculated levels are reference points for the scenarios, rather than confirmed areas where orders are concentrated.
EUR/USD
Current price — 1.12540, with a change of +0.32% in the latest snapshot. The pair has reached the upper boundary of its 1.12200–1.12540 range. The range is 0.00340 wide, or 34 pips.
The euro's intraday position looks firm, but the closing-price history does not confirm an established uptrend: the pair has lost 0.21% over five days and gained just 0.11% over 20 days. The current price is approximately 45% of the way up the monthly 1.11300–1.14030 range. The rise to the daily high is therefore taking place within a broader sideways market.
Support levels below the current price:
- 1.12370 — the midpoint of the daily range and the first reference level for gauging the depth of a potential pullback.
- 1.12200 — the low of the past 24 hours.
- 1.12000 — the next round-number level if the price breaks below the current range.
Resistance levels above the current price:
- 1.12710 — a calculated extension of half the daily range width above its high.
- 1.12880 — an upward projection of the full range width.
- 1.13000 — the next psychological level.
The price of 1.12540 is the current range boundary, so no separate resistance level is listed at the same price. A bullish scenario would require the price to hold above it and then advance toward 1.12710. A return below 1.12370 would weaken the current momentum and increase the likelihood of a test of 1.12200.
The typical daily move in the supplied statistics is 0.35%, equivalent to approximately 39 pips at the current exchange rate. This measures historical volatility; it does not limit the size of a move on CPI day.
Outlook for the next 24 hours — neutral. Consolidation near the upper part of the daily range is possible before the release. After 13:30 UTC, the inflation surprise will determine direction: weak data would support an advance, while strong data would favor a return toward support.
GBP/USD
Current price — 1.34550, with a change of +0.08%. The daily range is 1.34330–1.34590, leaving four pips to its high.
The pound has the strongest 20-day performance against the dollar among the currencies covered: +1.37%. However, its five-day return is almost flat at −0.02%. This looks more like a pause after a rise than a confirmed acceleration of the trend.
The current price is approximately 85% of the way up the monthly 1.32010–1.35000 range. Proximity to the upper boundary makes the 1.35000 area an important reference point, but does not itself guarantee either a breakout or a reversal.
Support:
- 1.34460 — the midpoint of the daily range.
- 1.34330 — the daily low.
- 1.34200 — a calculated extension of half the range width below the low.
Resistance:
- 1.34590 — the high of the past 24 hours.
- 1.34720 — an extension of half the daily range width above the high.
- 1.35000 — the upper boundary of the monthly range and a round-number level.
Holding above 1.34590 would improve the short-term structure, but a move toward 1.35000 would require additional momentum. A break below 1.34330 would signal a deeper correction. A typical daily move of 0.31% is equivalent to approximately 42 pips from the current price.
Outlook for the next 24 hours — neutral. The pound retains its relative strength, but the supplied calendar contains no separate UK catalyst. With daily EUR/USD and GBP/USD moves showing a correlation of +0.85, there is also no basis for forecasting opposite directions for them in advance. The historical accuracy of forecasts for the pound is 39%, further limiting the case for a directional signal before CPI.
USD/JPY
Current price — 157.951, with a change of +0.03%. The pair is in the lower half of its daily 157.864–158.124 range, whose midpoint is 157.994.
Based on daily closes, USD/JPY has fallen 0.24% over one day and 0.41% over 20 days, but is almost unchanged over five days at +0.03%. The small rise in the latest snapshot therefore does not alter the broader picture of consolidation with a moderate decline over the longer horizon.
Support:
- 157.864 — the low of the past 24 hours.
- 157.734 — a calculated extension of half the daily range width below the low.
- 157.500 — the next round-number level to watch on the downside.
Resistance:
- 157.994 — the midpoint of the daily range and the first barrier to a recovery.
- 158.124 — the daily high.
- 158.254 — an extension of half the range width above the high.
A break above 157.994 would increase the likelihood of another test of 158.124. A move below 157.864 would shift attention to 157.734 and then 157.500. A typical daily move of 0.27% is equivalent to approximately 0.426 yen, or 43 pips.
The response of interest rate expectations to CPI matters for USD/JPY. Higher inflation could support the dollar, while lower inflation could put it under pressure. No data on current yields or new Bank of Japan decisions is available, so these are not treated as established drivers of the move.
Outlook for the next 24 hours — neutral. The direction after CPI remains conditional. USD/JPY's monthly correlations with EUR/USD and GBP/USD are −0.20 and −0.24: an inverse relationship exists, but it is much weaker than a general dollar-based interpretation might suggest.
AUD/USD
Current price — 0.69310, with a change of +0.06%. The pair is at the high of its daily 0.69170–0.69310 range.
The short-term recovery is still taking place against weak performance over several days: −1.63% over five days and −1.15% over 20 days. Reaching the daily high therefore does not yet confirm a reversal of the sustained decline.
The current price is approximately 37% of the way up the monthly 0.68708–0.70340 range. This puts it in the lower half of the range, but not immediately next to its low.
Support:
- 0.69240 — the midpoint of the daily range.
- 0.69170 — the low of the past 24 hours.
- 0.69000 — the next psychological level.
Resistance:
- 0.69380 — a projection of half the daily range width above the current high.
- 0.69450 — an upward projection of the full range width.
- 0.69600 — the next round-number level to watch if the recovery continues.
Holding above 0.69240 would preserve near-term strength. A break below 0.69170 would increase the risk of a renewed decline. A typical daily move of 0.52% is equivalent to approximately 36 pips, substantially exceeding the current daily range width of 14 pips. This leaves room for the range to expand after the news, but does not determine direction.
Outlook for the next 24 hours — neutral. Previous AUD/USD forecasts have an accuracy rate of 37%, and the source data contains no separate Australian catalyst. A weak US CPI reading could allow the recovery to continue; a strong reading would make the negative performance over several days an additional argument for a test of support. Information on China, commodity prices or new RBA statements is absent and is not replaced with assumptions.
Gold (XAU/USD)
Current gold price — $4 115.30 per troy ounce. The latest snapshot shows 0.00%, while daily closing-price statistics show gains of 1.36% over one day and 1.07% over five days. These figures use different reference points; an unchanged reading in the current snapshot does not mean there was no earlier movement.
Gold has fallen 0.40% over 20 days. The current price is approximately 76% of the way up the monthly $3 897.05–4 185.88 range. The recent recovery has brought the metal closer to the upper part of that range, but it has yet to reach the monthly high.
All support levels listed below are below $4 115.30, and all resistance levels are above that price.
Support:
- $4 090.00 — the nearest calculated pullback level, approximately 0.61% below the current price.
- $4 072.09 — the current price minus one typical daily move of 1.05%.
- $4 050.00 — the next round-number level if the correction deepens.
Resistance:
- $4 140.00 — the nearest calculated upside level, approximately 0.60% above the current price.
- $4 158.51 — the current price plus one typical daily move of 1.05%.
- $4 185.88 — the high of the supplied monthly range.
The source data does not include a daily range for gold, so the nearest calculated levels cannot be described as confirmed intraday highs or lows. The historical standard deviation of 1.05% gives a measure of volatility equivalent to approximately $43.21 from the current price, but the post-CPI move could exceed that.
Inflation below forecast could support gold through a weaker dollar and a lower expected path for interest rates. Higher inflation could trigger the opposite response if the market focuses on the prospect of tight monetary policy. However, gold's actual correlation with EUR/USD over the past month is −0.44. In this dataset, gold is therefore not a reliable proxy for a position against the dollar.
Outlook for the next 24 hours — neutral. With overall historical forecast accuracy at 30%, there is insufficient basis to treat the recent rise as an unconditional signal of further gains. A move above $4 140.00 would strengthen the case for a move toward $4 158.51; a decline below $4 090.00 would increase the likelihood of a test of $4 072.09. Both scenarios depend on the reaction to CPI.
Bitcoin (BTC/USD)
Current BTC price — $74 634.00. The 24-hour change in the supplied percentage field is +0.19%. Trading volume over 24 hours is $24.68 billion. The absolute change field, “+0.19”, is inconsistent with the percentage at the quoted price, so it is not used to calculate the daily gain in dollars.
The medium-term picture remains weak: −7.22% over five days and −10.02% over 20 days. The current price is just $0.35 above the low of the monthly $74 633.65–84 082.27 range. The small positive change in the latest snapshot does not yet alter that position.
Support:
- $74 633.65 — the low of the monthly range; its minimal distance from the current price makes it a boundary being tested, rather than a broad support zone.
- $74 000.00 — the next round-number level below the range.
- $73 260.73 — the current price minus one typical daily move of 1.84%.
Resistance:
- $75 000.00 — the nearest round-number level to watch in a recovery.
- $76 007.27 — the current price plus one typical daily move of 1.84%.
- $77 000.00 — the next level to watch if the rebound develops.
Holding the monthly low and then holding above $75 000.00 would improve the short-term structure. A sustained break below the low would maintain pressure and open the way for a test of $74 000.00. Since no detailed trading history below the range is available, lower levels are calculated reference points rather than confirmed historical support.
Volume of $24.68 billion shows the scale of turnover, but without comparison with previous periods, it cannot be said to confirm seller capitulation or buyer accumulation. No measured correlation between BTC and the other instruments has been supplied.
Outlook for the next 24 hours — neutral, against a negative backdrop over several days. Proximity to the low allows for either a continued decline or a sharp rebound; neither outcome is confirmed yet. CPI could affect risk appetite, but automatically applying the dollar scenario to bitcoin would be inappropriate.
Relationships Between Instruments
The dollar is expected to trade sideways before CPI; its direction after the release remains uncertain.
This supports a consistent baseline assessment of neutral for EUR/USD, GBP/USD, USD/JPY, AUD/USD and gold. It does not imply a guaranteed quiet day: expected news-driven volatility is high, while the direction of the eventual move remains unknown. When the forecast is assessed in 24 hours, a strong breakout in either direction will make the neutral call incorrect — this risk needs to be acknowledged explicitly.
The closest relationship in the dataset is EUR/USD and GBP/USD: +0.85. Buying both largely duplicates exposure to the same factor. AUD/USD's relationships with the euro and pound are more moderate at +0.44 and +0.60. The Australian dollar adds some variation in behavior, but does not eliminate the shared risk of a reaction to US inflation.
USD/JPY has weak negative relationships with EUR/USD and GBP/USD at −0.20 and −0.24. The correlation between AUD/USD and USD/JPY is +0.10, meaning there was almost no linear relationship over the month. Nevertheless, the same release can move all these exchange rates at once, even when their average monthly correlation is low.
Gold stands out with a correlation of −0.44 with EUR/USD. This is an observed feature of the past month, so a simultaneous rise in the euro and gold cannot be assumed. BTC is considered separately because of its own downtrend and the absence of a measured relationship in the supplied sample.
In practice, four analytical groups emerge: the closely linked euro and pound, with AUD/USD partially aligned; USD/JPY; gold; and bitcoin. However, these are not four demonstrably independent bets. A full correlation matrix is unavailable, and shared CPI risk affects several groups at once.
If a weak CPI release leads to simultaneous long positions in EUR/USD, GBP/USD, AUD/USD and gold alongside a short position in USD/JPY, these would be five expressions of the same dollar-weakness idea. When all positions are aligned with one macroeconomic surprise, the group should be treated as one bet with cumulative risk, rather than five independent trades. The exact total risk depends on position sizes and the volatility of each instrument.
Differences in the current assessment reflect the observed history: the pound is stronger over 20 days, AUD is weaker, gold has recently recovered, and BTC remains near its monthly low. These differences affect how well the scenarios hold up, but do not yet justify assigning opposing directional forecasts to closely linked currency pairs.
Recommendations for Traders
The day's key time is 13:30 UTC. Interpreting the market reaction requires considering both headline and core CPI, their deviations from forecasts of 0.3% and 0.2%, and the content of Waller's speech. Until the actual readings are available, any conclusion about the release remains conditional.
Several factors matter when analyzing the move after the release:
- Holding beyond a level. A brief breakout from a range and sustained trading at a new price level send different signals; the initial reaction may reverse.
- Total dollar exposure. Simultaneous positions in the euro, pound and AUD can compound the same risk.
- Differences in volatility. Typical daily moves are 0.27–0.52% for the currencies covered, 1.05% for gold and 1.84% for BTC. These figures are not limits on price fluctuations.
- Execution quality. Spreads may widen, slippage may occur, and prices may quickly return inside the range at the time of the CPI release.
- Limited statistics. Historical forecast accuracy below 40% for AUD/USD, GBP/USD and gold does not support confident directional conclusions without a new, confirmed catalyst.
The outlook for all six instruments remains neutral for the next 24 hours. This is a forecast with limited confidence ahead of a major event: current data provides insufficient support for either a directional scenario or a confident prediction of a quiet day. After CPI, the actual surprise and whether the move holds relative to the stated levels will be decisive.
This material provides market analysis and does not constitute personalized investment advice.